
Introduction
Use this dashboard to see how the website visitors are using Bot Buster. This page shows statistics about the ease of use, premium subscriptions, feature usage and if they have taken advantage of additional security features.Search Filters
Search data by time, Countries, IP addresses, and Submission Types.
Statistics
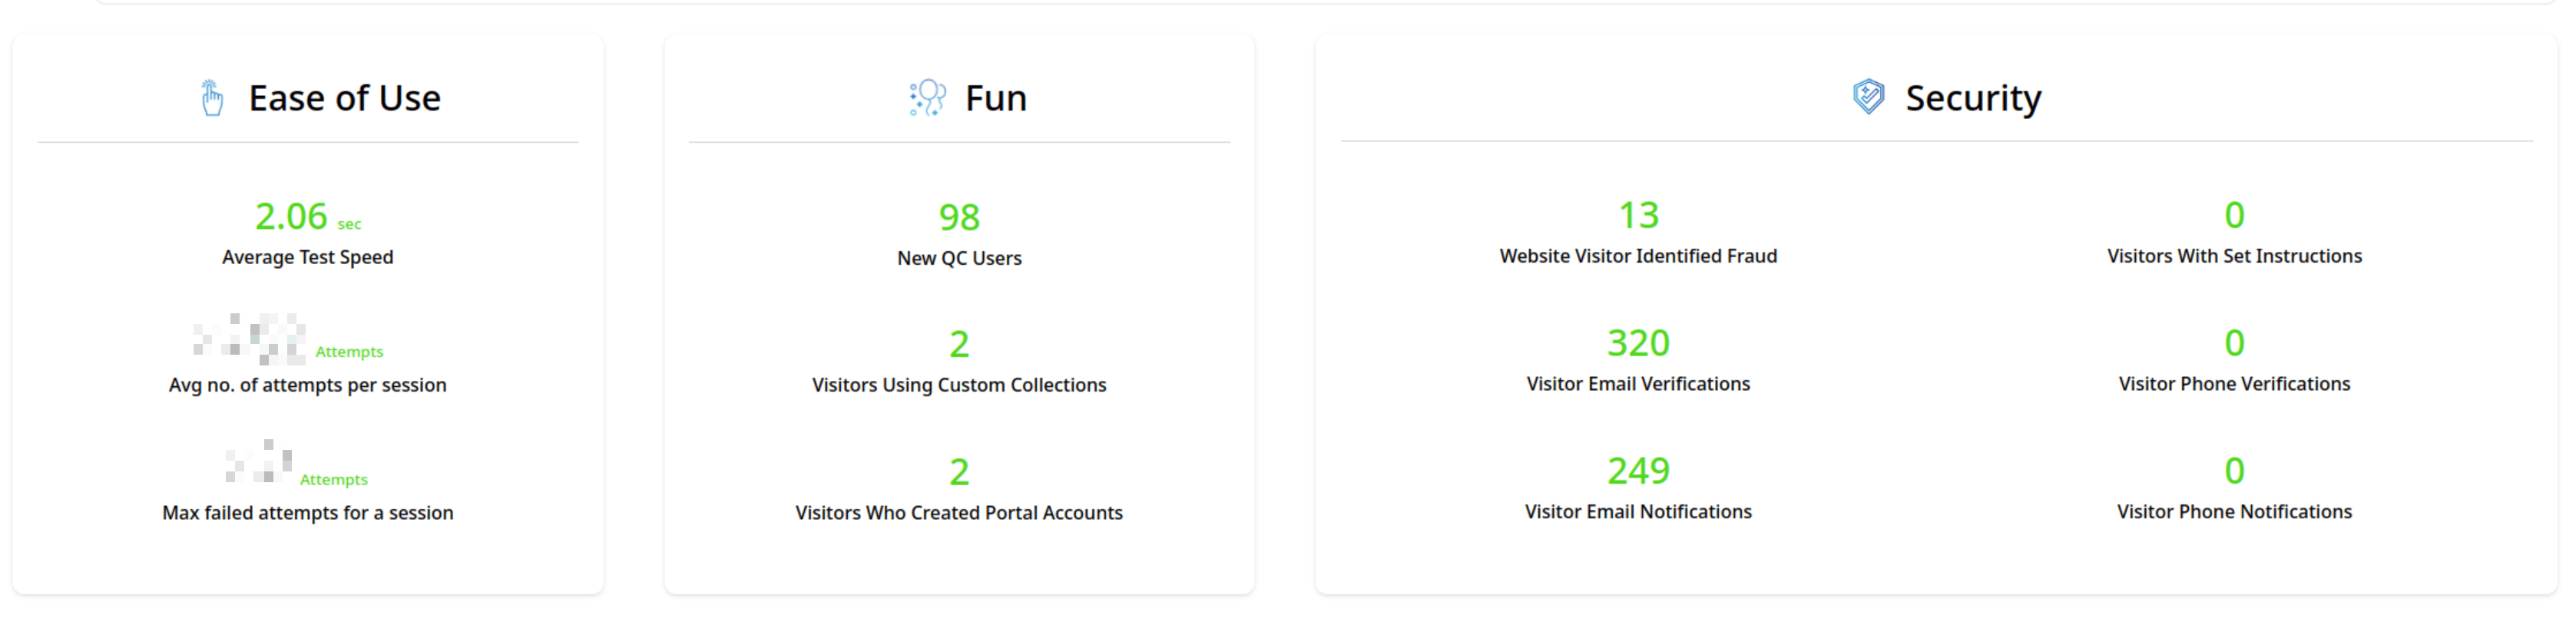
Ease of Use
To better understand how easy to use the Bot Buster Quick Check is for your users, see the average test speed, average number of attempts per session and max failed attempts per session.Fun
To better understand how much your users are enjoying using Bot Buster, the Fun group shows how many new Quick Check users there are, how many of those users are using custom collections and how many of the total users have created portal accounts.Security
To better understand how much your users are benefiting from and using security features, this section lists different security metrics of users.Time Charts
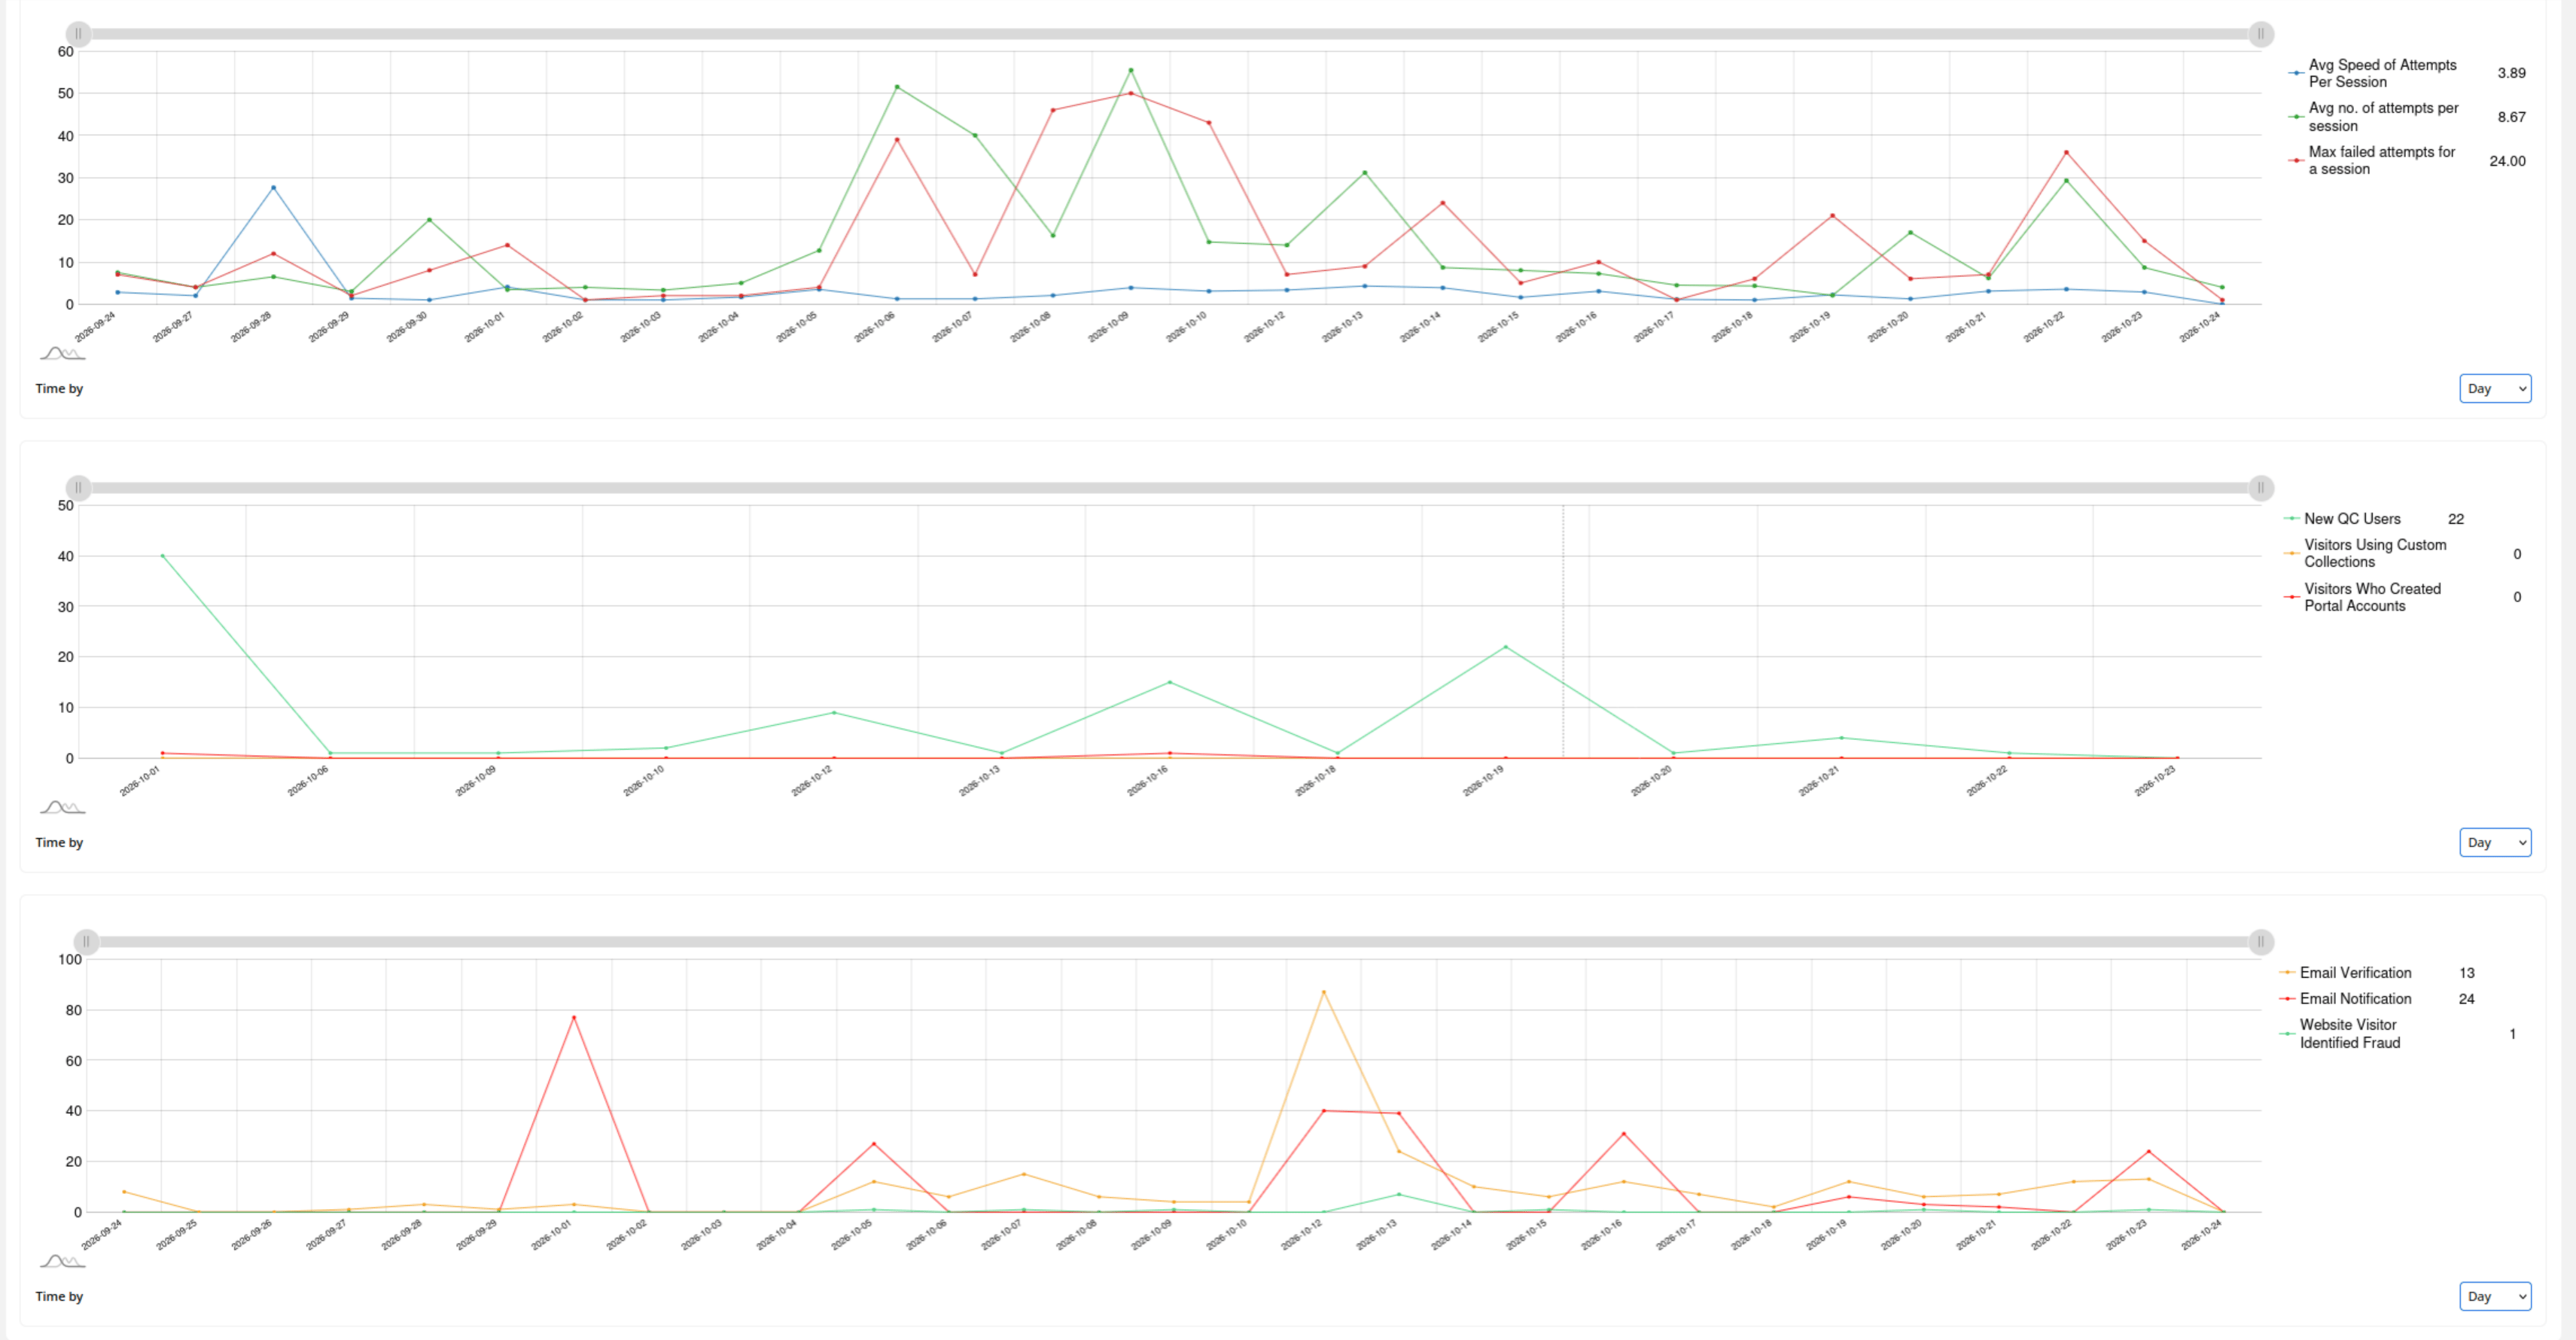
- View Ease of Use statistics in the top chart
- View Fun statistics in the middle chart
- View Security statistics in the bottom chart